
Explaining the 20-80 Scale
What is the 20-80 scale used by MLB scouts to evaluate players? How does it work? I do my best to answer questions like these here.

The 20-80 scale used by MLB scouts and major publications to grade draft and minor league prospects has caused confusion among baseball fans for quite some time. In reality, the 20-80 scale is easy to understand once you know what it represents. There is some nuance to it, but before we get into that, I’ll do my best to explain its main representation. I would highly encourage anyone reading this to conduct your own research on these topics because I am still learning myself and would certainly not consider myself to be an expert. However, given that it is deadline season and lots of prospects are likely to be moved, I thought it would be valuable to provide some base knowledge for the 20-80 scale and what these grades are saying about prospects.
As I have been taught, the 20-80 scale represents a perfect bell curve with 50 being the peak of the curve, representing the exact middle (in reality, this is not the case, but we’ll get into that later). If you see a 50 on someone’s scouting report, say a 50-grade hit tool, that means that player is major league average at making contact (approach is often baked into this, so you could say average here as well). All draft and minor league prospects are graded to major league performance. In other words, a 50-grade hit tool does not mean they are average at making contact at their current minor league level. It is a projection of what their current hitting ability would look like at the major league level.
Sticking with the bell curve, each full grade (10 points) represents one standard deviation from the mean (50). What the 20-80 scale does is help us identify how unique (good or bad) a player’s skills are and how much value they can realistically add, or subtract, from a major league roster. Without getting too granular, each time you move a full grade in either direction, you are entering a new tier of a tool or player because you have moved one standard deviation away from the mean of 50. Therefore, fewer players can be found here, increasing their absolute value (either positive or negative). 68% of tools and players should be found at 45, 50, and 55 on the scale (within one standard deviation); 95% should be found between 30 and 70 on the scale (within two standard deviations); and 99.7% should be found between 20 and 80 on the scale (within three standard deviations). In truth, the 20-80 scale is a misnomer. The scale goes from 0-100, but only 0.3% of tools and players could be found below 20 or above 80 on the scale (past three standard deviations from the mean of 50). Thus, the scale is truncated to 20-80 because it is exceptionally unlikely that you will ever encounter a player with a skill that lies beyond this point in either direction. In fact, grades lower than 30 and higher than 70 are similarly uncommon. An example of two of the top of my head would be Aaron Judge and O’Neil Cruz, both of whom possess 80 grade raw power (you could make the argument that O’Neil is the rare player who lies beyond this). Obviously, the amount of players with comparable raw power presently is non existent, highlighting that this level of talent in terms of potential power output is incredibly rare.
You will often see terms like below-average or well above average used in place of or alongside grades in scouting reports because these terms are generally easier to understand. The exact meaning of these terms varies, but here is my general guide on their counterparts on the 20-80 scale.
20 and 25 – very poor
30 – poor
35 – well below average
40 – below average
45 – fringe-average
50 – solid-average
55 – above average
60 – plus or well above average
65 – easily plus
70 – double-plus or exceptional
75 and 80 – elite, top of the scale
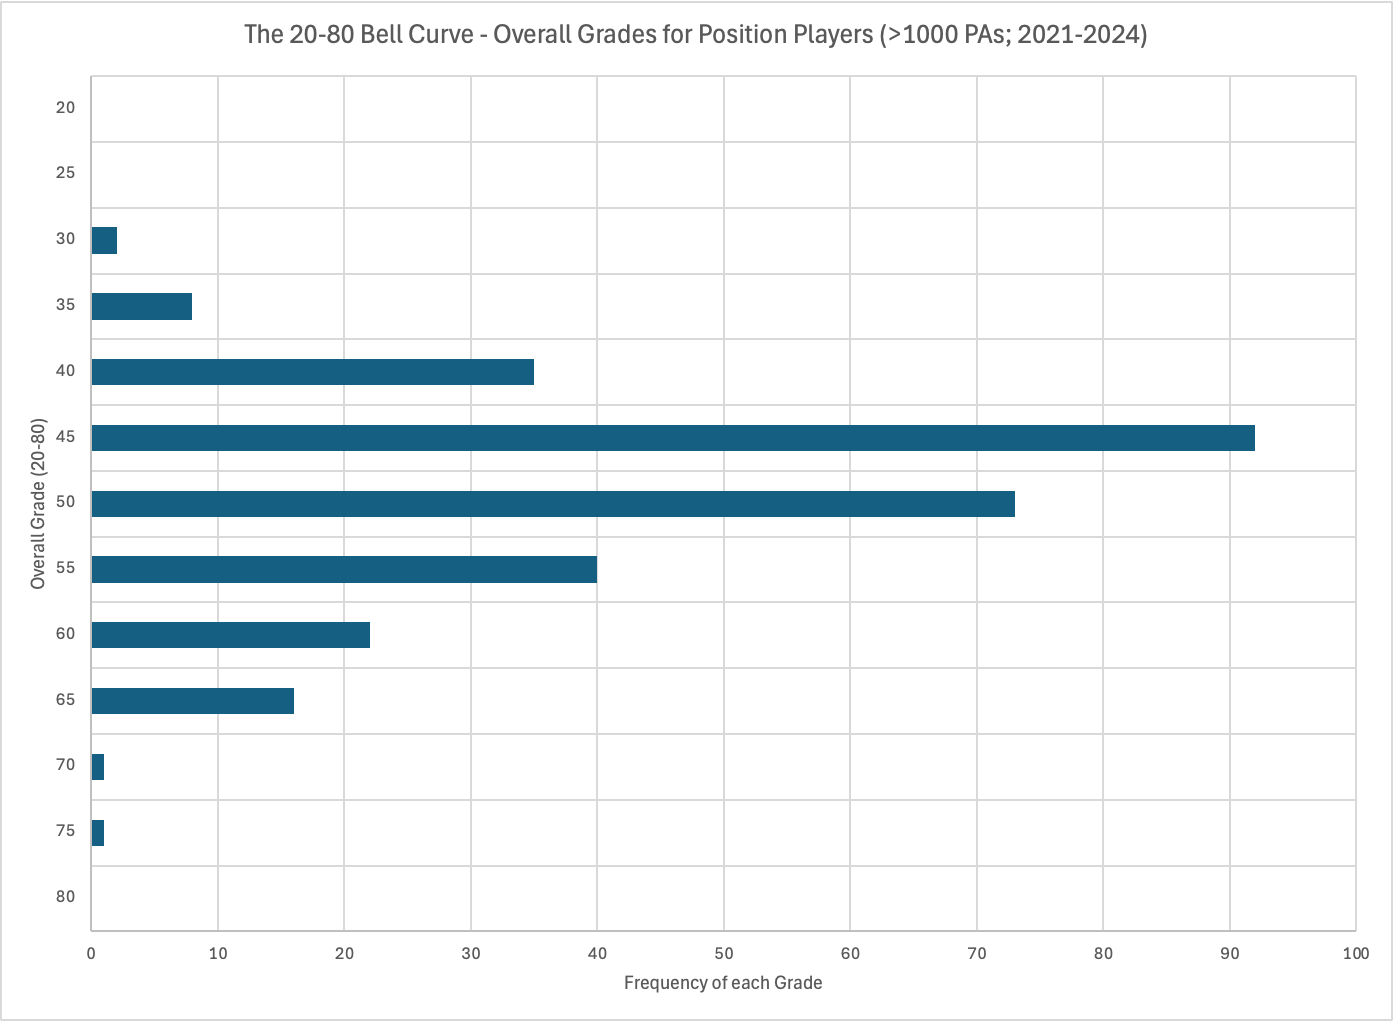
Now that we’ve got that out of the way, we can dig into a couple of the nuances I mentioned earlier. For starters, Overall or Future Value grades differ from the one used to grade skills or tools. While a 50 grade hit tool would identify someone with a major league average hitting ability, a 50 OVR player is not truly a major league average player. It is an average everyday player on a contending team. When we add in these qualifiers, it raises the threshold for a 50 grade player, making them more rare. In my most recent project, I confirmed that there are more players with a 45 OVR grade than a 50 OVR. This was with playing time qualifiers, however, and if we took those away, we would likely see that talent becomes increasingly rare as you move up the scale starting at 20. This is important because it explains why players who have 50 grade tools across the board sometimes have 45 OVR or FV grades. League average skills will not make a 50 grade player in some cases. (Note: Overall and Future Value are two ways of saying the same thing – how does this player impact a major league team; how much value are they adding or subtracting?)
It is also important to understand that not all grades are created equal, especially with fielding grades. For example, a shortstop with 50 grade fielding is a far superior defender to a first baseman with 50 grade fielding. When it comes to fielding grades, the value identifies the quality of that player’s defense compared to others at their same position, not to the league as a whole.
Overall and Future Value grades are also positionally dependent. The shortstop with 50 grade field has a lower threshold to meet in terms of offensive value to be a productive major league player, compared to the 50-grade fielding first baseman because of how much lower the position is on the defensive spectrum. This isn’t anything new. Players who play more important defensive positions (SS, CF, and C) can “get away with” providing below average offensive value because of how important it is to have a quality fielder at these spots. Likewise, this is why having great hitters at these positions can be such a huge advantage over the rest of the league.
As I said before, if you are interested, please do your own research. The information I have provided is objectively correct, but this is just a surface level explanation of these concepts. If you have any questions, do not hesitate to reach out via a comment on this article or through my BlueSky (linked here).